Report Example - Grade Report for One or More Years
In this example, we are creating a report that will show all the courses with grades that a student has taken over multiple years in the school - a transcript for grades K-8.
The Grade Averages custom report is very easy to adjust to your needs when creating a report for one or more students, one or more sections, one or more Academic Terms, etc.
In this example, we are creating a report that will show all the courses with grades that a student has taken over multiple years in the school. This is usually done with a Transcript report for High School, but this report allows you to produce a similar result for grades K-8.

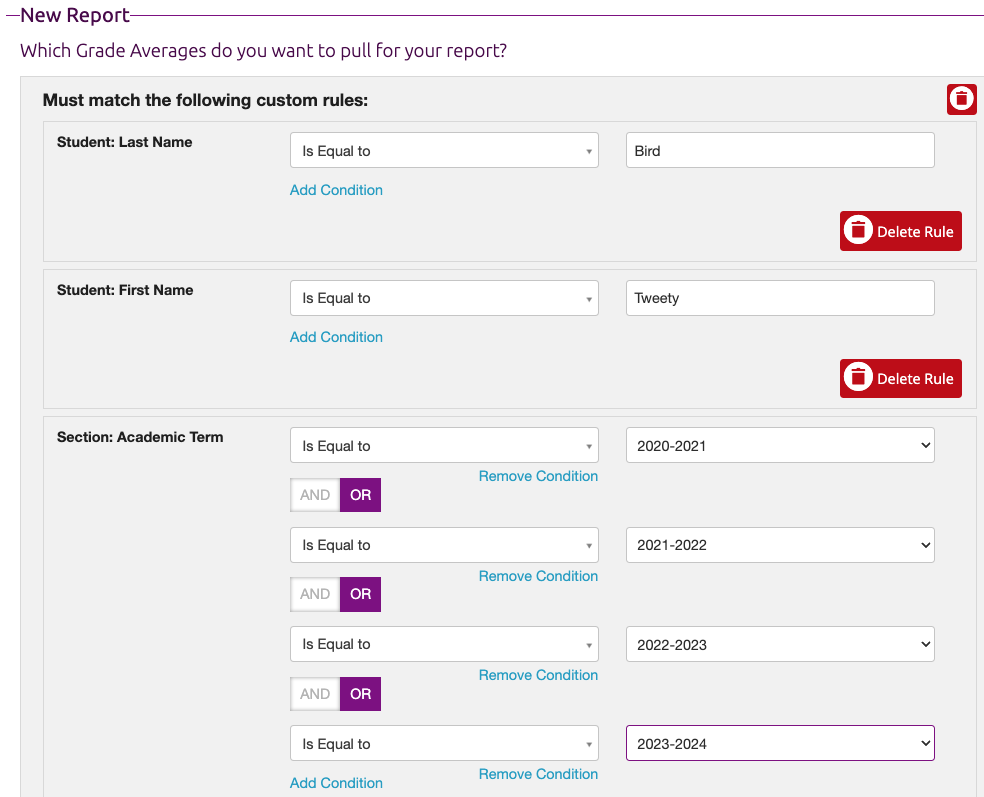
The first step is to filter the results for a specific student (Student: Last Name and Student: First Name) and the desired Academic Terms (Section: Academic Term for each year). Ensure that you use "OR" between the Academic Terms.

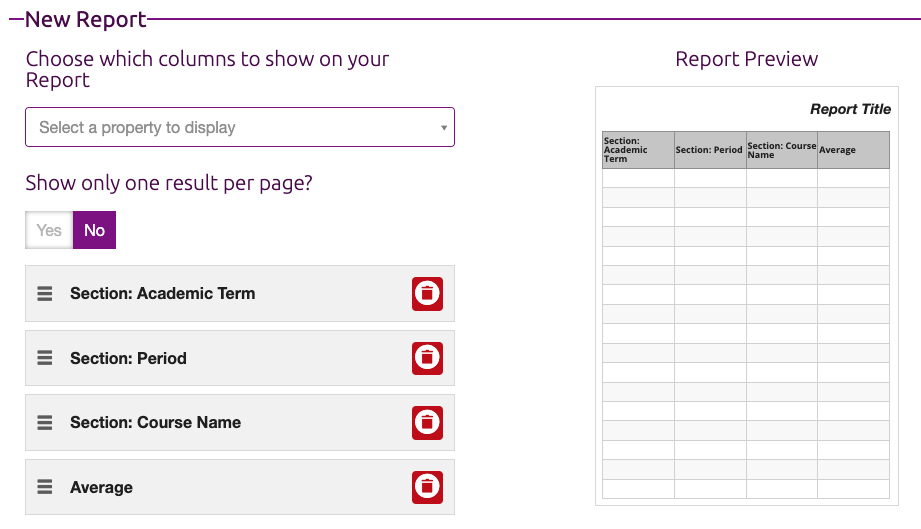
Next, we chose to show the following columns on the report:
1) Section: Academic Term
2) Section: Period
3) Section: Course Name
4) Average

The sort function will not sort the Academic Terms, so we're going to do that in MS Excel.

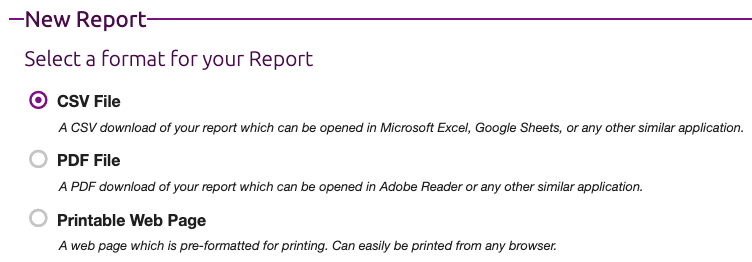
In order to format the report in MS Excel, export to a CSV file.

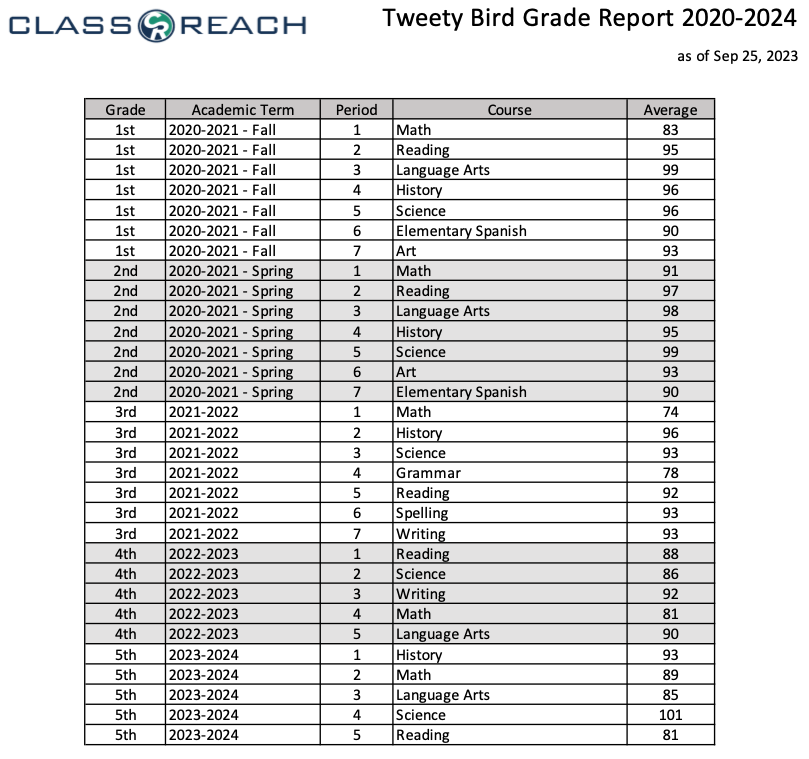
The last step is to format the report in MS Excel. In this example, we sorted by Academic Term and then Period; added the Grade column (The ClassReach Report didn't include this data); and, added formatting for the title, the logo and the data table. The first time you create the formatted report in Excel it will take some time to get it looking the way you want. After that first time, you can paste in new student's data, change the name, date and sort.
