Administration Analytics
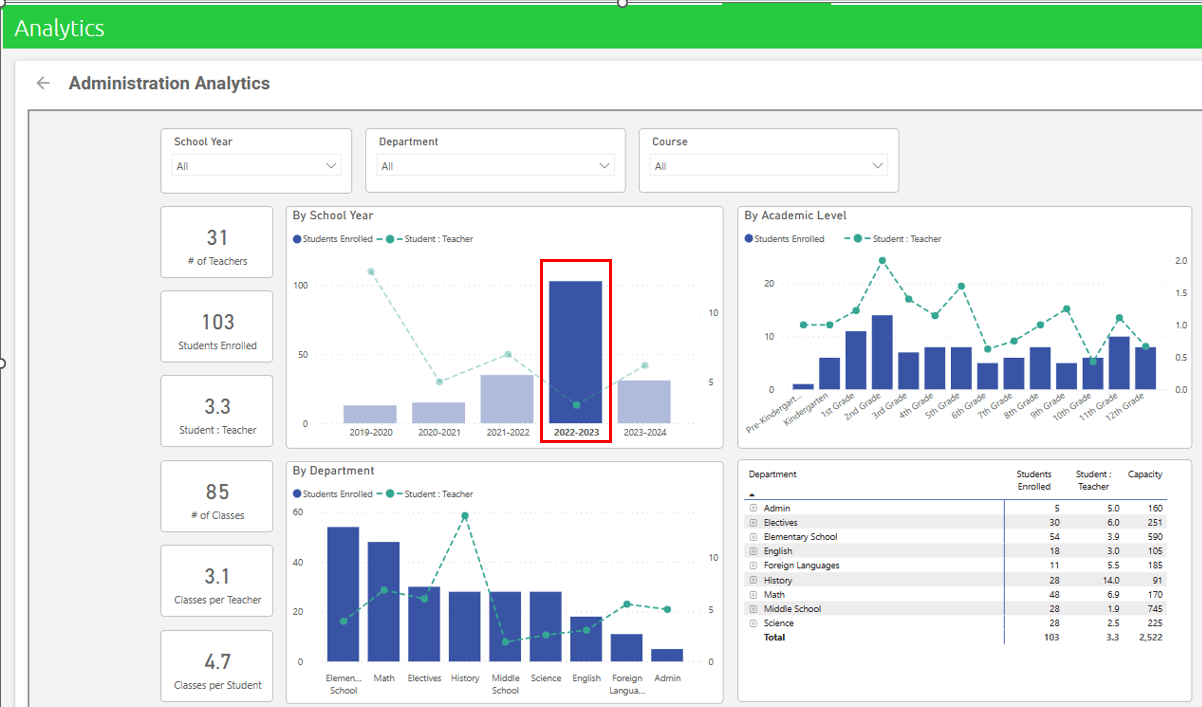
The reports found under Admin Analytics are intended to help you take a closer look at things like Student-Teacher ratios, by course, department, school year and academic levels. Attendance reports are also found here.
Data behind the visualizations refreshed nightly.
Each report has a timestamp with the last time the data was refreshed from your production data:

Student Teacher Ratio
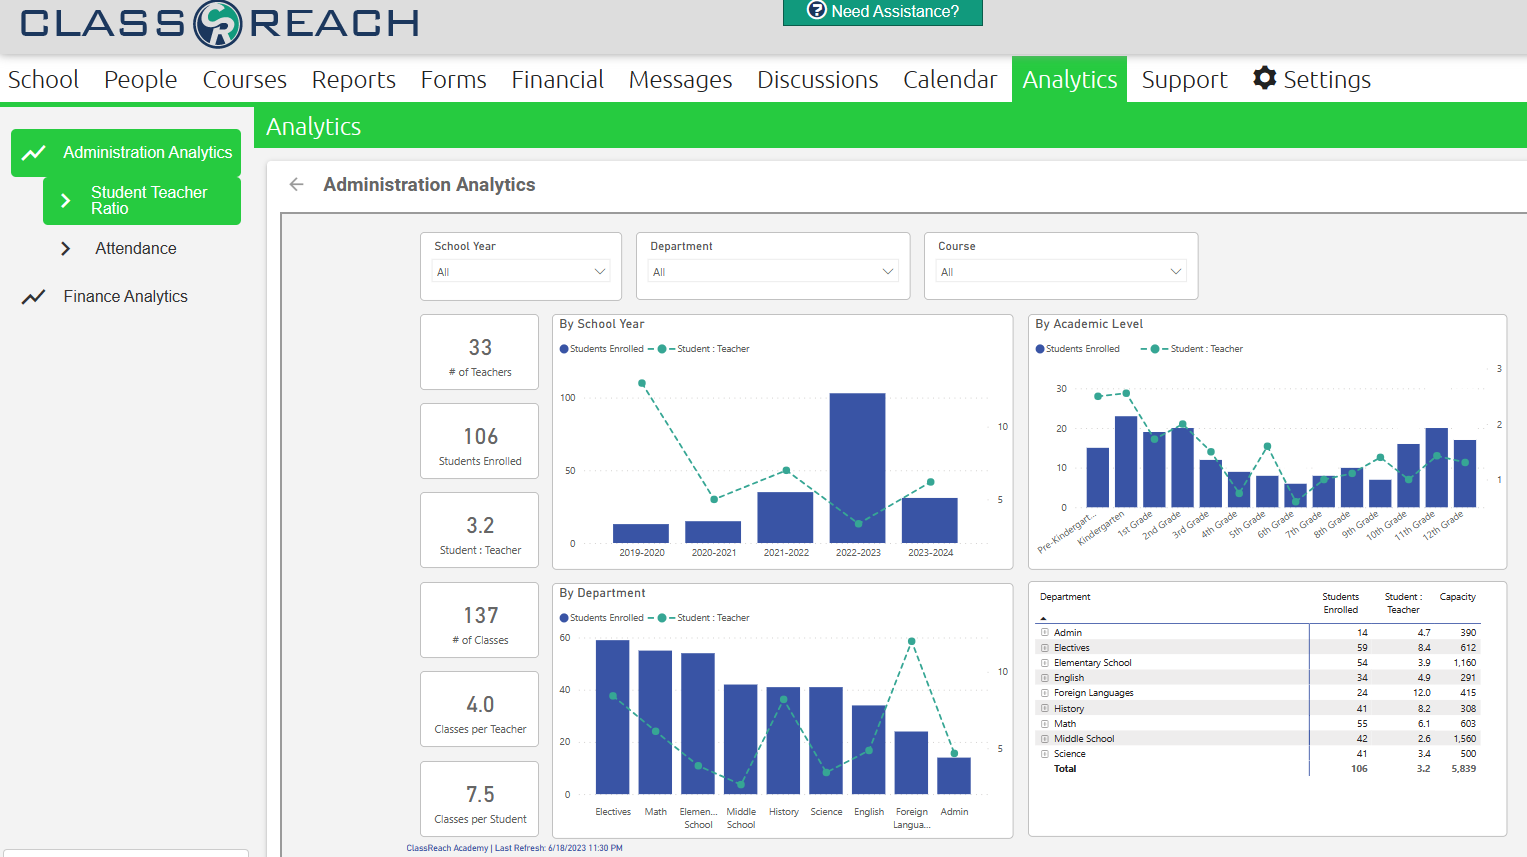
This report is intended to help you take a closer look at student-teacher ratios, by course, department, school year and academic levels. These are a great way to see where you may be light or heavy in enrollment verses teacher resources. They can also help you see trends across school years. The chart in the lower right gives insight into student enrollment by department, and also how those fare against course capacity for better planning.
Attendance
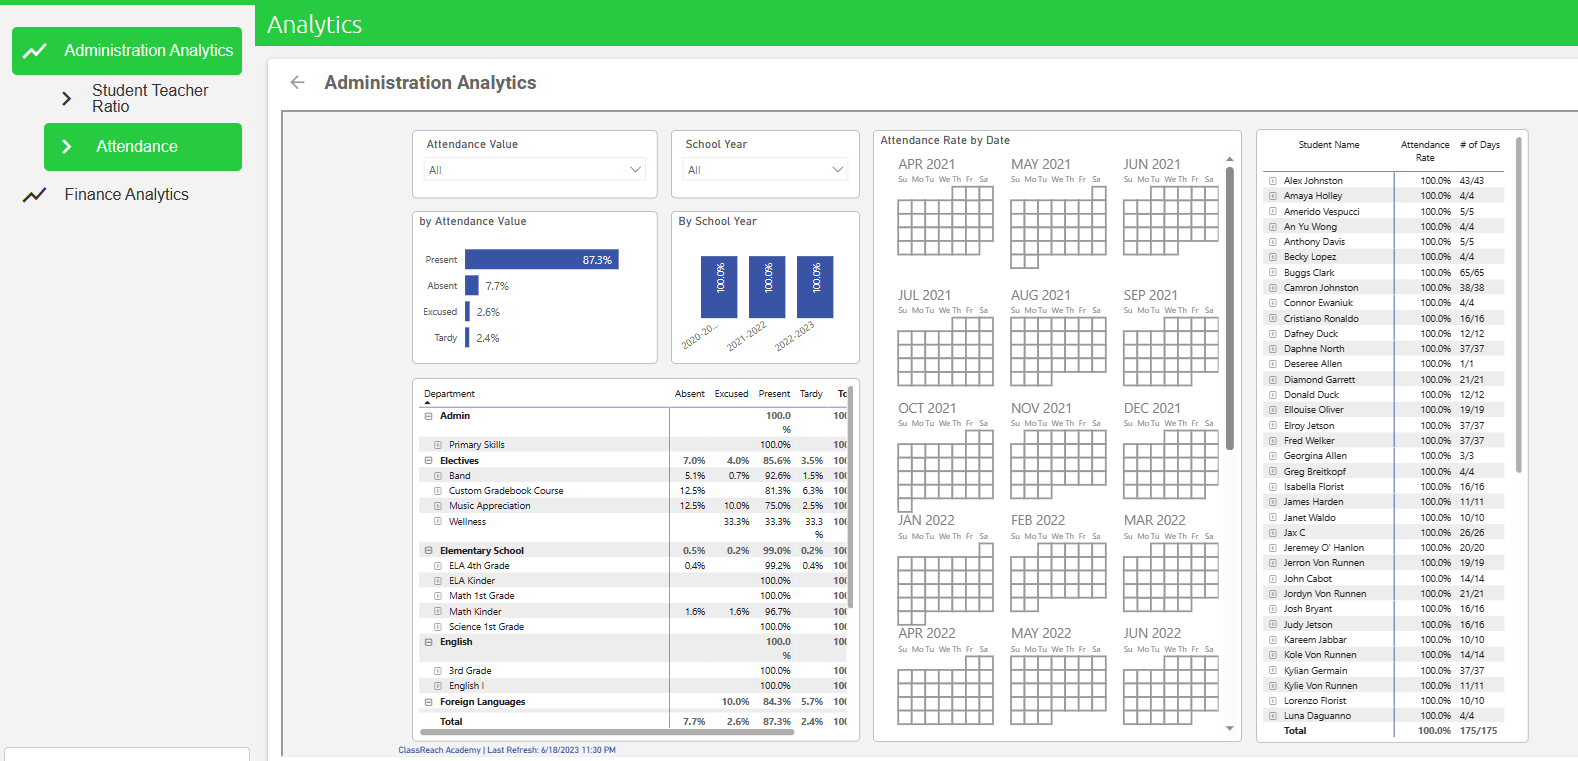
The Attendance report is useful to see trends in attendance, as well as dive deeper into a specific student attendance issue you may be investigating. It can also be useful when you are evaluating your school calendar start and end dates as well as holiday planning.
Common business intelligence features:
- Each chart/visualization will have a series of tools that can help you navigate further into your data. They become visible when you hover over the upper right (and sometimes lower right) of the chart:
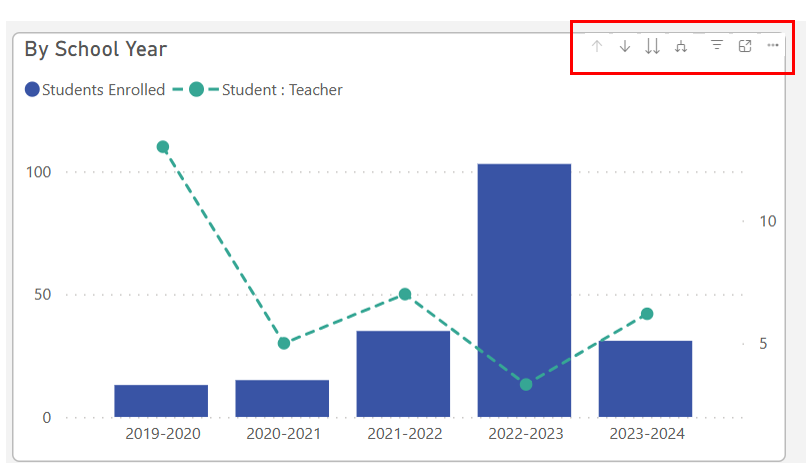

![]() Drill Up: When the chart has a hierarchy, this option allows you to drill up in the hierarchy.
Drill Up: When the chart has a hierarchy, this option allows you to drill up in the hierarchy.
 Drill Down: When the chart has a hierarchy, this allows you to drill down,
 Next Level: Drill down to the next level in the hierarchy.
 Expand: Expand all one level down in the hierarchy.
 Filters on visual:
 Focus mode: Expands the visualization to take up the entire page for easier viewing.
The three dots represent more options:
To export the data from a specific chart, choose Export Data and then Underlying Data for the most detailed export.

Filters: Often found at the top of the page, remove all but the data you want to focus on.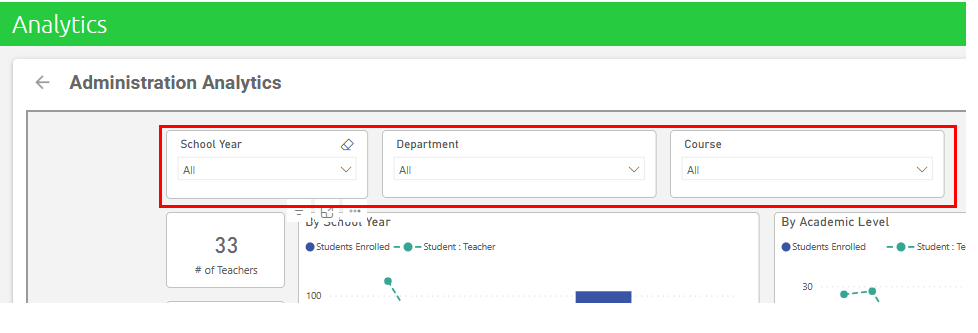
Highlighting: Is not the same as filtering. In most visuals, highlighted doesn't remove the unrelated data, instead it highlights the related data.