The Analytics Feature is available as part of the Basic package.
Contact sales@classreach to upgrade or to see a demo with your school's data.
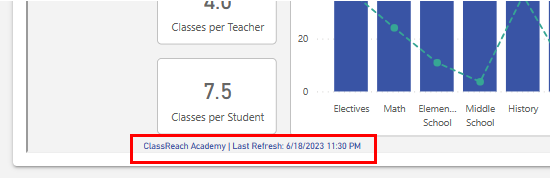
Data behind the visualizations refreshed nightly.
Each report has a timestamp with the last time the data was refreshed from your production data:
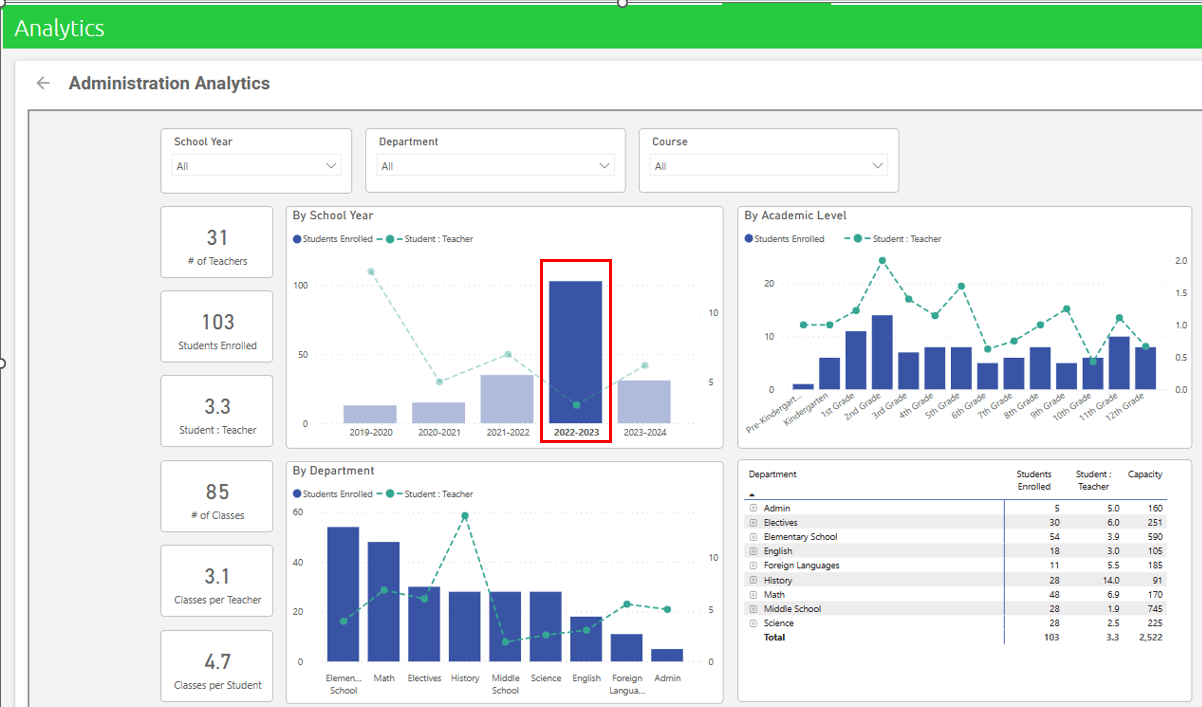
Administration Analytics
The reports found under Admin Analytics are intended to help you take a closer look at things like Student-Teacher ratios, by course, department, school year and academic levels. These are a great way to see where you may be light or heavy in enrollment verses teacher resources. There are also reports related to Attendance. which can help you see trends in attendance, as well as dive deeper into a specific student attendance issue you may be investigating.
For more details - see Administration Analytics
Financial Analytics
Administrators gain insights into their school's financial performance, enabling them to make data-driven decisions and optimize their resources.
By identifying areas for improvement and growth, schools can improve their financial sustainability and enhance their academic offerings.
- Comprehensive analysis of key financial metrics, including revenue, expenses, and cash flow.
- Monitoring of invoicing and tuition status and accounts receivable aging analysis.
- Financial charts and dashboards with historical trends.
- Comparative analysis of financial performance against past data.
For more details - see Finance Analytics
Common business intelligence features:
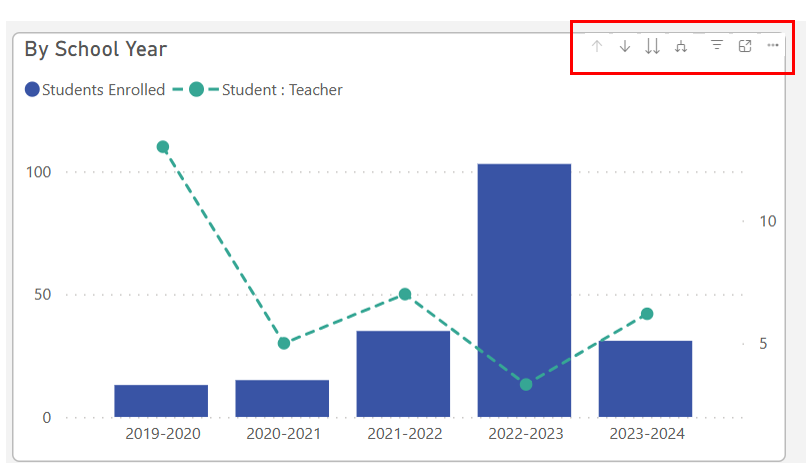
- Each chart/visualization will have a series of tools that can help you navigate further into your data. They become visible when you hover over the upper right (and sometimes lower right) of the chart:

![]() Drill Up: When the chart has a hierarchy, this option allows you to drill up in the hierarchy.
Drill Up: When the chart has a hierarchy, this option allows you to drill up in the hierarchy.
 Drill Down: When the chart has a hierarchy, this allows you to drill down,
 Next Level: Drill down to the next level in the hierarchy.
 Expand: Expand all one level down in the hierarchy.
 Filters on visual:
 Focus mode: Expands the visualization to take up the entire page for easier viewing.
The three dots represent more options:
Filters: Often found at the top of the page, remove all but the data you want to focus on.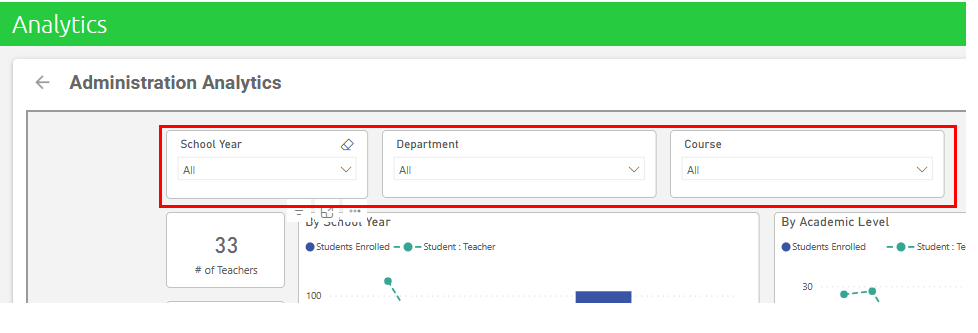
Highlighting: Is not the same as filtering. In most visuals, highlighted doesn't remove the unrelated data, instead it highlights the related data.